Average response time (ART): why it impacts your sales and how to improve it
Average response time is not just an operational KPI. It influences conversion, lead follow-up, retention, and perceived quality — and it can be reduced with process, automation, and omnichannel support.

Ryan Oliveira
Social Seller | Sales Executive | B2B and B2C Sales Specialist

Your team may have strong scripts, a competitive product, and a dedicated staff. Even so, if the response takes too long, the opportunity cools off.
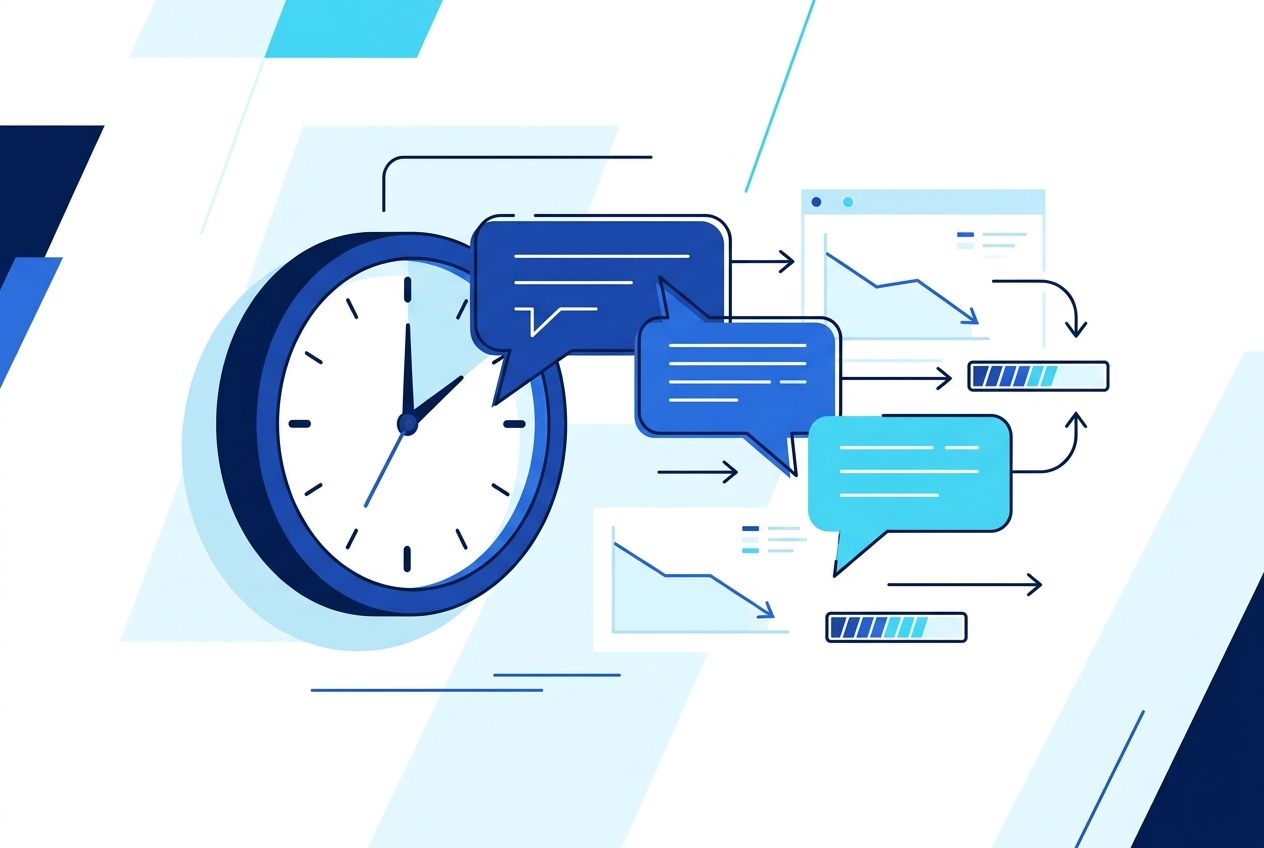
In customer service and conversational sales, timing is context. The longer the customer waits, the greater the chance they will give up, compare you with competitors, or simply lose the buying impulse.
That is why average response time is no longer just an operational KPI. It has become a metric directly tied to revenue, retention, productivity, and customer experience.
Quick summary
- ART is the average time your operation takes to respond to the customer — and it affects both customer service and sales.
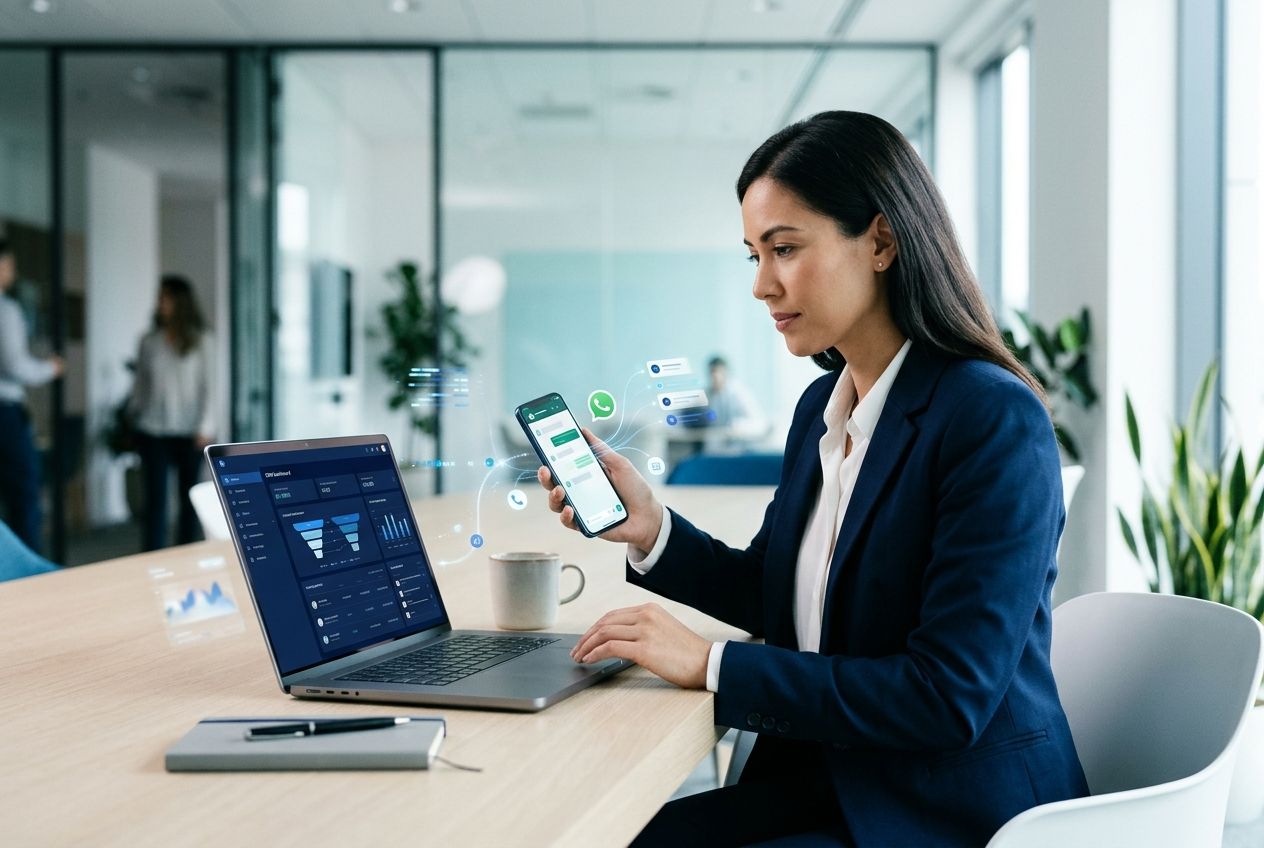
- Responding quickly increases the chance of moving the conversation forward, especially on messaging channels like WhatsApp and chat.
- ART is not SLA: SLA is the commitment; ART is what actually happens in practice.
- To reduce this metric without sacrificing quality, you need to combine process, intelligent distribution, automation, and a unified view of channels.
- In higher-volume operations, platforms like Flipdesk help centralize channels, automate triage, and track KPIs in real time.
What is average response time?
The average response time (ART) is the average interval between the customer's message and the company's reply.
In practice, it shows how quickly your operation can react when someone asks for information, support, a quote, or follow-up.
This metric is commonly used on channels such as:
- website chat
- Instagram and Facebook
- support tickets
ART, first response, resolution, and SLA: what is the difference?
These terms often appear together, but they are not the same thing.
| Metric | What it measures | Why it matters |
|---|---|---|
| **Average response time (ART)** | Average time to respond to the customer | Shows operational agility |
| **First response time** | How long the company takes to respond for the first time | It is decisive for the initial perception and conversation progress |
| **Resolution time** | Total time until the case is concluded | Measures efficiency in solving the issue, not just in replying |
| **Service SLA** | Formal target or time commitment | Defines expectations and operational governance |
Important: reducing ART does not mean replying carelessly. The goal is to gain speed without losing context, quality, and the ability to resolve the issue.
Why average response time impacts your sales
When a lead gets in touch, there is a short window of interest. If your operation takes too long, the chance of conversion drops — even if the product is good.
This is even more true in conversational channels, where the expectation for speed is high.
Market content about messaging apps points to this behavior clearly: on WhatsApp, 51% expect a response within 5 minutes and 19% within 1 minute. This reinforces something managers already feel day to day: on messaging channels, delays look like disorganization.
The practical effects of a high ART
1. Lower lead capture
Hot leads cool off fast. If the company takes too long to respond:
- the customer contacts another supplier;
- the need loses urgency;
- the conversation becomes harder to restart.
2. Lower sales conversion
In sales operations, the first reply acts as a signal of readiness. When it is delayed, the brand conveys low availability.
3. Poorer perception of quality
Even before evaluating the product or solution, the customer already starts forming an opinion about your company based on the pace of the response.
This point connects directly to what we already discussed in the article about why customer service is important for retention, sales, and efficiency.
4. More friction in retention
In support and post-sales, recurring delays create a feeling of abandonment. And that feeling of abandonment often turns into complaints, reopened cases, and churn.
5. More expensive and less predictable operations
The longer a queue sits still, the greater the backlog. This puts pressure on the team, worsens SLA performance, increases rework, and reduces productivity.
How to calculate ART in practice
The most commonly used formula is simple:
ART = sum of all response times ÷ total number of responses
Quick example
Imagine your team replied to 5 conversations with these response times:
- 2 minutes
- 4 minutes
- 8 minutes
- 10 minutes
- 6 minutes
Total sum: 30 minutes Total responses: 5
ART = 30 ÷ 5 = 6 minutes
What is worth measuring separately
To avoid drawing the wrong conclusions, track ART with segmentations.
Break it down by:
- channel;
- department;
- time of day;
- type of request;
- team or agent;
- first response versus responses throughout the conversation.
Without this, an overall average can hide important bottlenecks.
For example: an “okay” ART in the overall view may mask a slow WhatsApp response during business hours or an Instagram inbox with no coverage at the end of the day.
Benchmarks by channel: how to compare without falling into misleading averages
There is no universal benchmark for average response time that works for every company. An acceptable timeframe changes depending on:
- channel;
- conversation intent;
- average ticket size;
- service hours;
- request complexity;
- the expectation created by the brand itself.
Even so, you can use initial operating ranges as a reference. They do not replace your historical data, but they help structure realistic goals.
Initial reference ranges by channel
| Channel | Typical customer expectation | Recommended initial first-response target* | Notes |
|---|---|---|---|
| **WhatsApp** | Very high | up to 5 min during operating hours | An immediate conversation channel; delays cool off sales quickly |
| **Website chat** | Very high | up to 2 min | The user is at the moment of intent and may leave the page |
| **Instagram/Facebook inbox** | High | up to 10 min | The perception of speed still carries significant weight |
| **Email** | Moderate | up to 1 hour during business hours | Works better for less urgent topics |
| **Technical support with priority** | Varies by criticality | define by SLA | Here, priority and impact matter more than the overall average |
\*Use these targets as an operational starting point, not as a definitive market benchmark.
What to compare beyond the average
Looking only at the average can create a false sense of control. Ideally, you should also track:
- median, to reduce distortion from extreme cases;
- percentiles (such as P80 or P90), to understand consistency;
- SLA met vs. SLA missed;
- first response time;
- resolution time.
What most increases ART in the operation
In most companies, the problem is not just “lack of staff.” Usually, ART rises because of a combination of structural bottlenecks.
Most common bottlenecks
- channels spread across different tools;
- manual triage with no prioritization;
- conversations coming into the same number without clear distribution;
- dependence on a single device or login;
- lack of unified customer history;
- lack of after-hours automation;
- little visibility into queues, peaks, and SLA;
- weak integration between support, CRM, and the sales team.
In operations that still rely only on the standard app, this tends to get worse as volume grows. If this is your scenario, it is also worth reading: WhatsApp Business API: what it is, how it works, and when your company should adopt it.
How to improve average response time without losing quality
Lowering ART for real takes more than just “replying faster.” Sustainable gains come when process, technology, and management work together.
1. Centralize channels in one place
When WhatsApp, Instagram, Facebook, and website chat are separated, the team loses time switching screens, repeating context, and leaving messages behind.
Ideally, you should operate from a unified inbox, with visible history and centralized management.
This is one of the practical benefits of platforms like Flipdesk, which bring together official and unofficial WhatsApp Business API, Instagram, Facebook, and website chat in a single environment. This reduces context switching and speeds up response from the very first contact.
2. Distribute conversations intelligently
One of the biggest reasons for delays is disorganized intake.
To reduce ART, define distribution rules by:
- department;
- subject;
- time of day;
- priority;
- lead source;
- agent skill set.
This way, the conversation reaches the right person faster. Instead of depending on manual handoff, the queue becomes more predictable.
In practice, this is especially useful in operations with multiple agents on the same number, without agent collision and with team-based routing.
3. Automate the initial triage
Not every conversation needs to start with a human. Many do, however, need an immediate and well-directed response.
Good automation helps to:
- confirm receipt;
- identify intent;
- collect initial data;
- prioritize urgency;
- route to the correct queue;
- maintain 24/7 service.
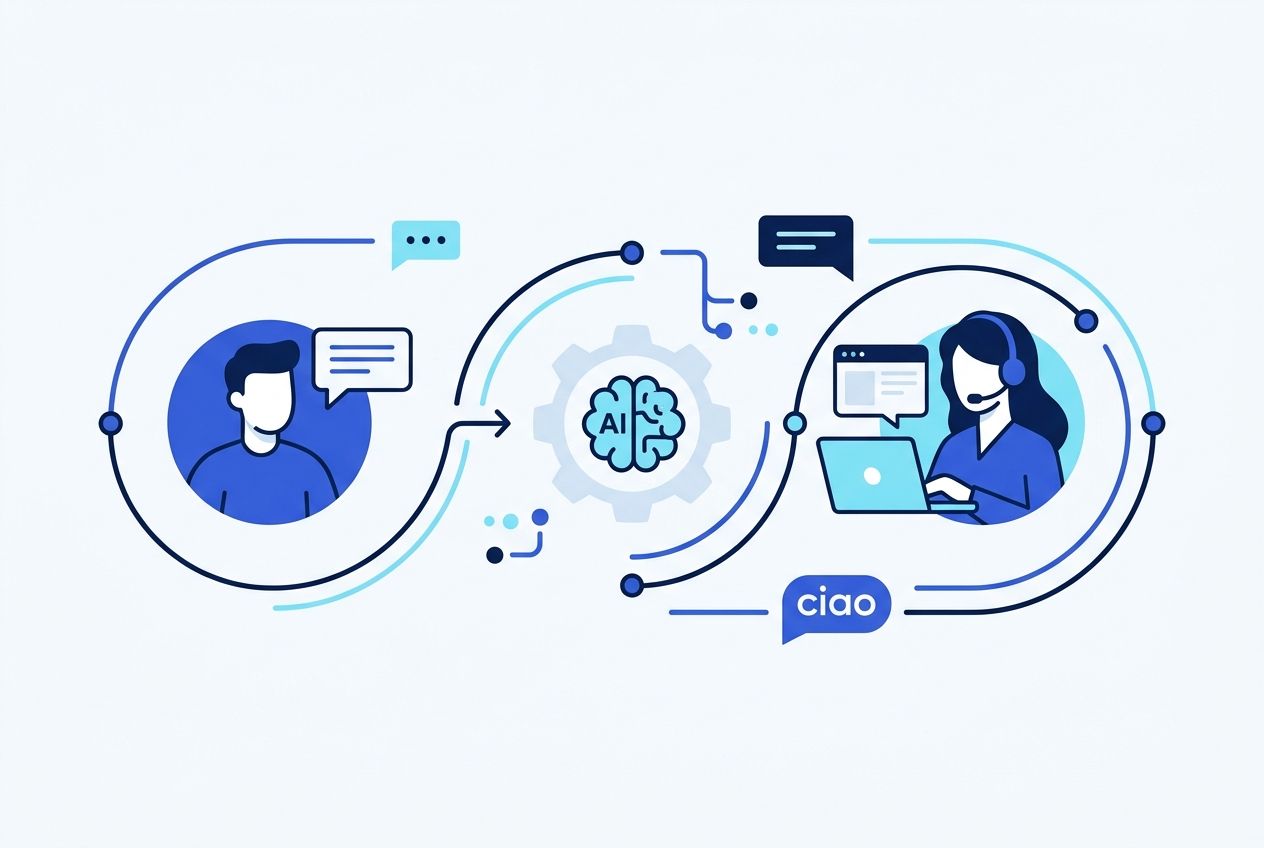
The key point is to avoid empty automation. Ideally, use an AI chatbot trained on your business context, automation block flows, and clear handoff to human support when needed.
At Flipdesk, this can be done with AI chatbot, automated flows, and ChatGPT integration, in addition to FlipAI for 24/7 service in scenarios that require speed at scale.
Practical rule: good automation reduces wait time and organizes the queue. Bad automation only increases frustration.
4. Create standardized responses for what repeats most
The goal is not to make service robotic. It is to remove waste.
Build a base for recurring questions, opening messages, data confirmation, process status, and next steps.
This shortens the time between reading, understanding, and replying.
If you want to go deeper into the topic on a critical channel for many operations, check out this content about how to improve customer service on WhatsApp without losing quality.
5. Track ART in real time, not just at the end of the month

If you only look at the metric in the final report, you discover the problem too late.
Ideally, you should have a real-time dashboard, with visibility into:
- active queues;
- wait time;
- SLA close to the limit;
- volume by channel;
- team productivity;
- service quality.
This kind of monitoring lets you act the same day — by redistributing the queue, adjusting staffing, or reinforcing peak hours.
6. Integrate support with CRM and other systems
A slow agent is not always an unproductive agent. Many times, they are hunting for information across disconnected systems.
When support connects with CRM, APIs, and other internal tools, the team gains context faster and responds better.
This reduces both the first response time and the effort needed to move the conversation forward.
7. Structure the right operating model
There are operations in which ART rises because the company chose a model that is incompatible with the volume or the channels.
That is why, in addition to the tool, it is worth reviewing team structure, roles, priorities, and coverage. This material about customer service models helps with that analysis.
Response time on WhatsApp: where many sales are won — or lost
On WhatsApp, the expectation for speed is usually higher than on asynchronous channels.
This happens because the customer starts the conversation expecting near-immediate continuity. When they do not get a reply, the perception is not just “delay.” It often becomes:
- uncertainty;
- doubt about reliability;
- loss of interest;
- conversation abandonment.
This scenario weighs heavily on:
- lead generation;
- quotes;
- billing and relationship management;
- sales support;
- post-sales.
That is why operations that want to reduce ART on WhatsApp usually need to improve on three fronts at the same time:
- channel structure, so they do not depend on a single device;
- intelligent distribution, so the conversation reaches the right team;
- automation with context, to speed up the first contact.
30-day action plan to reduce ART
If you want to move from theory to practice and improve the metric quickly, follow this sequence.
Week 1: diagnosis
- map ART by channel and time of day;
- separate first response and resolution;
- identify peaks and critical queues;
- list the 10 most recurring requests.
Week 2: organization
- define owners by channel and priority;
- create triage rules;
- standardize frequent responses;
- adjust coverage during the highest-volume hours.
Week 3: automation
- implement useful initial messages;
- set up routing by department;
- automate the collection of basic data;
- create clear handoff to a human.
Week 4: ongoing management
- track the dashboard daily;
- review SLA by type of request;
- monitor ART, FRT, and resolution together;
- connect support with CRM and commercial goals.
Common mistakes when trying to reduce ART
Replying fast, but replying poorly
Speed without context only pushes the problem further down the line.
Measuring only the overall average
Without segmentation by channel and time of day, the average hides bottlenecks.
Ignoring peak hours
Your ART does not get worse “out of nowhere.” It usually gets worse in predictable windows.
Automating everything indiscriminately
There are cases where the customer wants quick direction; there are others where they need human listening.
Not connecting ART to sales and retention
When the metric is treated only as a support metric, the company misses the chance to connect it to revenue, conversion, and churn.
Final summary
If you only need to keep the essentials, it is this:
- average response time is both an operational and a business metric;
- it impacts conversion, retention, and perceived quality;
- measuring only the average is not enough: you need to look at channel, time of day, first response, and SLA;
- sustainable improvement comes from centralization, automation, intelligent distribution, and real-time management.
When these pillars become part of the process, the team stops firefighting and starts responding with more speed, predictability, and context.
Also read
- WhatsApp Business API: what it is, how it works, and when your company should adopt it
- Why customer service is important for retention, sales, and efficiency
- How to improve customer service on WhatsApp without losing quality
- Customer service models: how to choose the ideal one for your operation
FAQ
What is ART in customer service?
It is the average time the company takes to respond to the customer after a request or message.
Is ART the same thing as SLA?
No. ART is the real result of the operation. SLA is the target or time commitment defined by the company.
What is the difference between average response time and first response time?
First response time measures only the first reply. ART, on the other hand, may consider the average of responses across the operation, depending on the criterion adopted.
How do you improve average response time?
The main ways are: centralize channels, automate triage, distribute conversations by priority, and track the metric in real time.
Does response time on WhatsApp influence sales?
Yes. On messaging channels, the expectation for speed is high. When the response takes too long, the conversation cools off and the chance of conversion decreases.
---
Want to reduce your ART with more control and less improvisation?
If your operation is already struggling to respond quickly across multiple channels, it is worth getting to know Flipdesk.
With the platform, your company can centralize channels, manage teams, automate service, distribute conversations intelligently, and track KPIs, SLA, and quality in real time — all in one place.
Request a Flipdesk demo and see how to speed up service and sales without losing context or quality.
How Flipdesk supports this scenario
When talking about average response time, it is worth looking beyond isolated tips. In real operations, results improve when service, context, automation, and monitoring are organized within the same flow.
The Flipdesk helps in this scenario by:
- centralizing WhatsApp, Instagram, Facebook, and website chat in one place;
- organizing queues, departments, history, and conversation owners;
- allowing multiple agents on the same number with greater operational control;
- automating steps with chatbot, AI, flows, and 24/7 service with FlipAI;
- tracking metrics, SLA, quality, and integrations with CRM and APIs.
This makes the operation more consistent, reduces improvisation, and helps the team scale service and sales with greater confidence.
Next step
Turn what you read into a faster, more predictable service flow.
If this article speaks to a real challenge your team faces, FlipDesk can help structure operations, automation, and context in one place.
Keep reading
More posts to dive deeper.
A curated selection of articles to keep reading without losing context.